Data guide · 2022
A note on satellite imagery data
Introduction
I have seen more and more papers utilizing satellite imagery data, especially in the environmental economics domain. There are many benefits of using those imagery data and one of such is their very much fine-scaled and consistent spatial and temporal resolutions. Some satellites could provide data at a minute-level frequency and meter-level (or even centimeter-level) spatial scale. These satellite imagery data can be used to infer changes in natural endowment (i.e., land cover, water level, glacier, soil conditions, air quality, etc.) and changes in social characteristics (i.e., population density, economic activity, migration pattern, etc.) as well as to spot natural disasters (i.e., wildfire, flood, hurricane, etc.). The richness of the data and its linkage between natural resources and society greatly advance its application in the analysis of climate change.
The aim of this post is twofold. On the one hand, I will collect sources of satellite imagery data on a regular basis. If you google “satellite imagery data”, you will find a list of such collections already exist. Although most of them point to similar sources, I still think the collections are overwhelming and find it difficult to pin down the specific data to use. Thus, I decided to turn to the literature and observe the widely used satellite imagery data in papers written by climate modelers and economists. On the other hand, after identifying the data, the question turns to be how to handle them. I answer this question in the second part of the post. It should be noted though satellite imagery data themselves are new to me. Being said, this post is by no means a professional tutorial. Instead, it simply documents my learning-by-doing journey with satellite imagery data.
Where to find the data
To begin with, we primarily focus on freely accessible products which are usually provided by the government or research institutions. In the context of satellite imagery, a few examples are:
Although three products are listed above, I will focus on the first two. Simply by exploring their websites, you will discover how abundant the data they provide are, and as I pointed out previously, it is difficult to filter out the data you truly need. The good news is that NASA offers multiple powerful data portals that allow users to assess, search, and subset its data pool (see Earthdata). Besides, NOAA also features such tools and is also an ideal source for climate-related data (National Centers for Environmental Information).
In most cases, the satellite imagery data provided by NASA are ready to use, meaning you do not need to perform additional atmospheric corrections, which saves tons of time for non-technical users.
Now back to our data search tool Earthdata, it essentially collects data from all three products mentioned above. There are two powerful tools within Earthdata.
Data Pathfinders allows you to explore the data by topics, such as Agricultural and Water Resources, Biological Diversity and Ecological Forecasting, Disasters, Diseases, Geographic Information Systems (GIS), Greenhouse Gases, Health and Air Quality, Sustainable Development Goals, Water Quality, and Wildfires. Each tab leads you to a specific collection of data closely related to the topic.
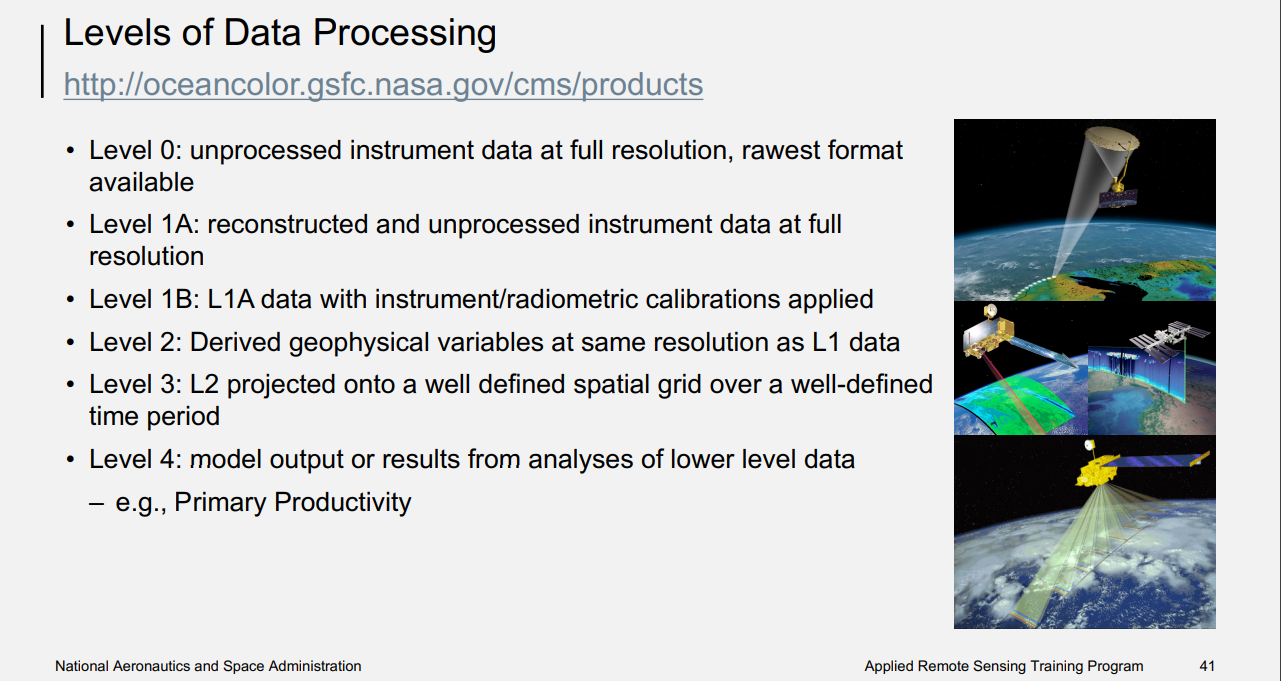
As an alternative, you can directly explore and filter out data within Earthdata Search by Keywords (Agriculture, Atmosphere, Cryosphere, Human Dimensions, Land Surface, etc.), by Platforms (Air-based Platforms, Land-based Platforms, etc.), by Instruments (Satellite), by Processing Levels (i.e., 0, 1, 1A, 1B, 2, 3, 4). This is the critical part. Normally, we do not want to touch those raw data leveled at 0 and 1. Instead, we prefer those level 3 data which have already been projected onto a well-defined spatial grid over a well-defined time period. Additionally, you can also filter the data by Data Format, Horizontal Data Resolution (spatial scale). This is one of the most efficient ways to pin down the desired data.
Another tool worth mentioning is the Worldview function which allows you to interactively browse and download full-resolution, global satellite imagery from over 1000 data products in NASA. Similar functions developed by NASA such as Giovanni can also be used to do the task.
So far, we already have an overview of satellite imagery data. The rest of this part will be given to specific satellite data that I collect from the literature.
How to use the data
To be continued.